Showing posts with label Linux. Show all posts

Wednesday, March 10, 2010

chmod

File permissions

Use the chmod command to set file permissions.

The chmod command uses a three-digit code as an argument.

The three digits of the chmod code set permissions for these groups in this order:

  1. Owner (you)
  2. Group (a group of other users that you set up)
  3. World (anyone else browsing around on the file system)

Each digit of this code sets permissions for one of these groups as follows. Read is 4. Write is 2. Execute is 1.

The sums of these numbers give combinations of these permissions:

  • 0 = no permissions whatsoever; this person cannot read, write, or execute the file
  • 1 = execute only
  • 2 = write only
  • 3 = write and execute (1+2)
  • 4 = read only
  • 5 = read and execute (4+1)
  • 6 = read and write (4+2)
  • 7 = read and write and execute (4+2+1)
Chmod commands on file apple.txt (use wildcards to include more files)
CommandPurpose
chmod 700 apple.txt Only you can read, write to, or execute apple.txt
chmod 777 apple.txt Everybody can read, write to, or execute apple.txt
chmod 744 apple.txt Only you can read, write to, or execute apple.txt Everybody can read apple.txt;
chmod 444 apple.txt You can only read apple.txt, as everyone else.

Detecting File Permissions

You can use the ls command with the -l option to show the file permissions set. For example, for apple.txt, I can do this:

$ ls -l apple.txt
-rwxr--r-- 1 december december 81 Feb 12 12:45 apple.txt
$

The sequence -rwxr--r-- tells the permissions set for the file apple.txt. The first - tells that apple.txt is a file. The next three letters, rwx, show that the owner has read, write, and execute permissions. Then the next three symbols, r--, show that the group permissions are read only. The final three symbols, r--, show that the world permissions are read only.


Monday, January 25, 2010

Install HTK on SLES10sp2

1. Add  http://demeter.uni-regensburg.de/SLES10SP2-x64/DVD1/ to the install source if no DVD is in the computer;

2. Install package: glibc-devel-32bit

zypper se glibc # search for the package in software source
zypper in glibc-devel-32bit

3. ./configure --disable-hslab

4. make all

5. make install

Wednesday, January 20, 2010

x86_64 Linux Error: gnu/stub-32.h missing error and solution

x86_64 Linux Error: gnu/stub-32.h missing error and solution

by Vivek Gite · 2 comments

Q. I'm getting the following error while compiling application under CentOS / RHEL / Fedora Linux 64 bit edition:

/usr/include/gnu/stubs.h:7:27: error: gnu/stubs-32.h:

No such file or directory

How do I fix this error?

A. You need to install the glibc-devel package. It contains the object files necessary for developing programs which use the standard C libraries (which are used by nearly all programs). If you are developing programs which will use the standard C libraries, your system needs to have these standard object files available in order to create the executables.

Install glibc-devel if you are going to develop programs which will use the standard C libraries.
# yum -y install glibc-devel
Now again try to recompile application.


20 Linux System Monitoring Tools Every SysAdmin Should K

20 Linux System Monitoring Tools Every SysAdmin Should Know

by Vivek Gite · 97 comments
From: http://www.cyberciti.biz/tips/top-linux-monitoring-tools.html

Need to monitor Linux server performance? Try these built-in command and a few add-on tools. Most Linux distributions are equipped with tons of monitoring. These tools provide metrics which can be used to get information about system activities. You can use these tools to find the possible causes of a performance problem. The commands discussed below are some of the most basic commands when it comes to system analysis and debugging server issues such as:

1. Finding out bottlenecks.
2. Disk (storage) bottlenecks.
3. CPU and memory bottlenecks.
4. Network bottlenecks.


#1: top - Process Activity Command

The top program provides a dynamic real-time view of a running system i.e. actual process activity. By default, it displays the most CPU-intensive tasks running on the server and updates the list every five seconds.
Fig.01: Linux top command

Fig.01: Linux top command
Commonly Used Hot Keys

The top command provides several useful hot keys:
Hot Key Usage
t Displays summary information off and on.
m Displays memory information off and on.
A Sorts the display by top consumers of various system resources. Useful for quick identification of performance-hungry tasks on a system.
f Enters an interactive configuration screen for top. Helpful for setting up top for a specific task.
o Enables you to interactively select the ordering within top.
r Issues renice command.
k Issues kill command.
z Turn on or off color/mono


=> Related: How do I Find Out Linux CPU Utilization?

#2: vmstat - System Activity, Hardware and System Information

The command vmstat reports information about processes, memory, paging, block IO, traps, and cpu activity.
# vmstat 3
Sample Outputs:

procs -----------memory---------- ---swap-- -----io---- --system-- -----cpu------
r b swpd free buff cache si so bi bo in cs us sy id wa st
0 0 0 2540988 522188 5130400 0 0 2 32 4 2 4 1 96 0 0
1 0 0 2540988 522188 5130400 0 0 0 720 1199 665 1 0 99 0 0
0 0 0 2540956 522188 5130400 0 0 0 0 1151 1569 4 1 95 0 0
0 0 0 2540956 522188 5130500 0 0 0 6 1117 439 1 0 99 0 0
0 0 0 2540940 522188 5130512 0 0 0 536 1189 932 1 0 98 0 0
0 0 0 2538444 522188 5130588 0 0 0 0 1187 1417 4 1 96 0 0
0 0 0 2490060 522188 5130640 0 0 0 18 1253 1123 5 1 94 0 0

Display Memory Utilization Slabinfo

# vmstat -m
Get Information About Active / Inactive Memory Pages

# vmstat -a
=> Related: How do I find out Linux Resource utilization to detect system bottlenecks?

#3: w - Find Out Who Is Logged on And What They Are Doing

w command displays information about the users currently on the machine, and their processes.
# w username
# w vivek
Sample Outputs:

17:58:47 up 5 days, 20:28, 2 users, load average: 0.36, 0.26, 0.24
USER TTY FROM LOGIN@ IDLE JCPU PCPU WHAT
root pts/0 10.1.3.145 14:55 5.00s 0.04s 0.02s vim /etc/resolv.conf
root pts/1 10.1.3.145 17:43 0.00s 0.03s 0.00s w

#4: uptime - Tell How Long The System Has Been Running

The uptime command can be used to see how long the server has been running. The current time, how long the system has been running, how many users are currently logged on, and the system load averages for the past 1, 5, and 15 minutes.
# uptime
Output:

18:02:41 up 41 days, 23:42, 1 user, load average: 0.00, 0.00, 0.00

1 can be considered as optimal load value. The load can change from system to system. For a single CPU system 1 - 3 and SMP systems 6-10 load value might be acceptable.

#5: ps - Displays The Processes

ps command will report a snapshot of the current processes. To select all processes use the -A or -e option:
# ps -A
Sample Outputs:

PID TTY TIME CMD
1 ? 00:00:02 init
2 ? 00:00:02 migration/0
3 ? 00:00:01 ksoftirqd/0
4 ? 00:00:00 watchdog/0
5 ? 00:00:00 migration/1
6 ? 00:00:15 ksoftirqd/1
....
.....
4881 ? 00:53:28 java
4885 tty1 00:00:00 mingetty
4886 tty2 00:00:00 mingetty
4887 tty3 00:00:00 mingetty
4888 tty4 00:00:00 mingetty
4891 tty5 00:00:00 mingetty
4892 tty6 00:00:00 mingetty
4893 ttyS1 00:00:00 agetty
12853 ? 00:00:00 cifsoplockd
12854 ? 00:00:00 cifsdnotifyd
14231 ? 00:10:34 lighttpd
14232 ? 00:00:00 php-cgi
54981 pts/0 00:00:00 vim
55465 ? 00:00:00 php-cgi
55546 ? 00:00:00 bind9-snmp-stat
55704 pts/1 00:00:00 ps

ps is just like top but provides more information.
Show Long Format Output

# ps -Al
To turn on extra full mode (it will show command line arguments passed to process):
# ps -AlF
To See Threads ( LWP and NLWP)

# ps -AlFH
To See Threads After Processes

# ps -AlLm
Print All Process On The Server

# ps ax
# ps axu
Print A Process Tree

# ps -ejH
# ps axjf
# pstree
Print Security Information

# ps -eo euser,ruser,suser,fuser,f,comm,label
# ps axZ
# ps -eM
See Every Process Running As User Vivek

# ps -U vivek -u vivek u
Set Output In a User-Defined Format

# ps -eo pid,tid,class,rtprio,ni,pri,psr,pcpu,stat,wchan:14,comm
# ps axo stat,euid,ruid,tty,tpgid,sess,pgrp,ppid,pid,pcpu,comm
# ps -eopid,tt,user,fname,tmout,f,wchan
Display Only The Process IDs of Lighttpd

# ps -C lighttpd -o pid=
OR
# pgrep lighttpd
OR
# pgrep -u vivek php-cgi
Display The Name of PID 55977

# ps -p 55977 -o comm=
Find Out The Top 10 Memory Consuming Process

# ps -auxf | sort -nr -k 4 | head -10
Find Out top 10 CPU Consuming Process

# ps -auxf | sort -nr -k 3 | head -10

#6: free - Memory Usage

The command free displays the total amount of free and used physical and swap memory in the system, as well as the buffers used by the kernel.
# free
Sample Output:

total used free shared buffers cached
Mem: 12302896 9739664 2563232 0 523124 5154740
-/+ buffers/cache: 4061800 8241096
Swap: 1052248 0 1052248

=> Related: :

1. Linux Find Out Virtual Memory PAGESIZE
2. Linux Limit CPU Usage Per Process
3. How much RAM does my Ubuntu / Fedora Linux desktop PC have?

#7: iostat - Average CPU Load, Disk Activity

The command iostat report Central Processing Unit (CPU) statistics and input/output statistics for devices, partitions and network filesystems (NFS).
# iostat
Sample Outputs:

Linux 2.6.18-128.1.14.el5 (www03.nixcraft.in) 06/26/2009

avg-cpu: %user %nice %system %iowait %steal %idle
3.50 0.09 0.51 0.03 0.00 95.86

Device: tps Blk_read/s Blk_wrtn/s Blk_read Blk_wrtn
sda 22.04 31.88 512.03 16193351 260102868
sda1 0.00 0.00 0.00 2166 180
sda2 22.04 31.87 512.03 16189010 260102688
sda3 0.00 0.00 0.00 1615 0

=> Related: : Linux Track NFS Directory / Disk I/O Stats

#8: sar - Collect and Report System Activity

The sar command is used to collect, report, and save system activity information. To see network counter, enter:
# sar -n DEV | more
To display the network counters from the 24th:
# sar -n DEV -f /var/log/sa/sa24 | more
You can also display real time usage using sar:
# sar 4 5
Sample Outputs:

Linux 2.6.18-128.1.14.el5 (www03.nixcraft.in) 06/26/2009

06:45:12 PM CPU %user %nice %system %iowait %steal %idle
06:45:16 PM all 2.00 0.00 0.22 0.00 0.00 97.78
06:45:20 PM all 2.07 0.00 0.38 0.03 0.00 97.52
06:45:24 PM all 0.94 0.00 0.28 0.00 0.00 98.78
06:45:28 PM all 1.56 0.00 0.22 0.00 0.00 98.22
06:45:32 PM all 3.53 0.00 0.25 0.03 0.00 96.19
Average: all 2.02 0.00 0.27 0.01 0.00 97.70

=> Related: : How to collect Linux system utilization data into a file

#9: mpstat - Multiprocessor Usage

The mpstat command displays activities for each available processor, processor 0 being the first one. mpstat -P ALL to display average CPU utilization per processor:
# mpstat -P ALL
Sample Output:

Linux 2.6.18-128.1.14.el5 (www03.nixcraft.in) 06/26/2009

06:48:11 PM CPU %user %nice %sys %iowait %irq %soft %steal %idle intr/s
06:48:11 PM all 3.50 0.09 0.34 0.03 0.01 0.17 0.00 95.86 1218.04
06:48:11 PM 0 3.44 0.08 0.31 0.02 0.00 0.12 0.00 96.04 1000.31
06:48:11 PM 1 3.10 0.08 0.32 0.09 0.02 0.11 0.00 96.28 34.93
06:48:11 PM 2 4.16 0.11 0.36 0.02 0.00 0.11 0.00 95.25 0.00
06:48:11 PM 3 3.77 0.11 0.38 0.03 0.01 0.24 0.00 95.46 44.80
06:48:11 PM 4 2.96 0.07 0.29 0.04 0.02 0.10 0.00 96.52 25.91
06:48:11 PM 5 3.26 0.08 0.28 0.03 0.01 0.10 0.00 96.23 14.98
06:48:11 PM 6 4.00 0.10 0.34 0.01 0.00 0.13 0.00 95.42 3.75
06:48:11 PM 7 3.30 0.11 0.39 0.03 0.01 0.46 0.00 95.69 76.89

=> Related: : Linux display each multiple SMP CPU processors utilization individually.

#10: pmap - Process Memory Usage

The command pmap report memory map of a process. Use this command to find out causes of memory bottlenecks.
# pmap -d PID
To display process memory information for pid # 47394, enter:
# pmap -d 47394
Sample Outputs:

47394: /usr/bin/php-cgi
Address Kbytes Mode Offset Device Mapping
0000000000400000 2584 r-x-- 0000000000000000 008:00002 php-cgi
0000000000886000 140 rw--- 0000000000286000 008:00002 php-cgi
00000000008a9000 52 rw--- 00000000008a9000 000:00000 [ anon ]
0000000000aa8000 76 rw--- 00000000002a8000 008:00002 php-cgi
000000000f678000 1980 rw--- 000000000f678000 000:00000 [ anon ]
000000314a600000 112 r-x-- 0000000000000000 008:00002 ld-2.5.so
000000314a81b000 4 r---- 000000000001b000 008:00002 ld-2.5.so
000000314a81c000 4 rw--- 000000000001c000 008:00002 ld-2.5.so
000000314aa00000 1328 r-x-- 0000000000000000 008:00002 libc-2.5.so
000000314ab4c000 2048 ----- 000000000014c000 008:00002 libc-2.5.so
.....
......
..
00002af8d48fd000 4 rw--- 0000000000006000 008:00002 xsl.so
00002af8d490c000 40 r-x-- 0000000000000000 008:00002 libnss_files-2.5.so
00002af8d4916000 2044 ----- 000000000000a000 008:00002 libnss_files-2.5.so
00002af8d4b15000 4 r---- 0000000000009000 008:00002 libnss_files-2.5.so
00002af8d4b16000 4 rw--- 000000000000a000 008:00002 libnss_files-2.5.so
00002af8d4b17000 768000 rw-s- 0000000000000000 000:00009 zero (deleted)
00007fffc95fe000 84 rw--- 00007ffffffea000 000:00000 [ stack ]
ffffffffff600000 8192 ----- 0000000000000000 000:00000 [ anon ]
mapped: 933712K writeable/private: 4304K shared: 768000K

The last line is very important:

* mapped: 933712K total amount of memory mapped to files
* writeable/private: 4304K the amount of private address space
* shared: 768000K the amount of address space this process is sharing with others

=> Related: : Linux find the memory used by a program / process using pmap command

#11 and #12: netstat and ss - Network Statistics

The command netstat displays network connections, routing tables, interface statistics, masquerade connections, and multicast memberships. ss command is used to dump socket statistics. It allows showing information similar to netstat. See the following resources about ss and netstat commands:

* ss: Display Linux TCP / UDP Network and Socket Information
* Get Detailed Information About Particular IP address Connections Using netstat Command

#13: iptraf - Real-time Network Statistics

The iptraf command is interactive colorful IP LAN monitor. It is an ncurses-based IP LAN monitor that generates various network statistics including TCP info, UDP counts, ICMP and OSPF information, Ethernet load info, node stats, IP checksum errors, and others. It can provide the following info in easy to read format:

* Network traffic statistics by TCP connection
* IP traffic statistics by network interface
* Network traffic statistics by protocol
* Network traffic statistics by TCP/UDP port and by packet size
* Network traffic statistics by Layer2 address

Fig.02: General interface statistics: IP traffic statistics by network interface

Fig.02: General interface statistics: IP traffic statistics by network interface
Fig.03 Network traffic statistics by TCP connection

Fig.03 Network traffic statistics by TCP connection

#14: tcpdump - Detailed Network Traffic Analysis

The tcpdump is simple command that dump traffic on a network. However, you need good understanding of TCP/IP protocol to utilize this tool. For.e.g to display traffic info about DNS, enter:
# tcpdump -i eth1 'udp port 53'
To display all IPv4 HTTP packets to and from port 80, i.e. print only packets that contain data, not, for example, SYN and FIN packets and ACK-only packets, enter:
# tcpdump 'tcp port 80 and (((ip[2:2] - ((ip[0]&0xf)<<2)) - ((tcp[12]&0xf0)>>2)) != 0)'
To display all FTP session to 202.54.1.5, enter:
# tcpdump -i eth1 'dst 202.54.1.5 and (port 21 or 20'
To display all HTTP session to 192.168.1.5:
# tcpdump -ni eth0 'dst 192.168.1.5 and tcp and port http'
Use wireshark to view detailed information about files, enter:
# tcpdump -n -i eth1 -s 0 -w output.txt src or dst port 80

#15: strace - System Calls

Trace system calls and signals. This is useful for debugging webserver and other server problems. See how to use to trace the process and see What it is doing.

#16: /Proc file system - Various Kernel Statistics

/proc file system provides detailed information about various hardware devices and other Linux kernel information. See Linux kernel /proc documentations for further details. Common /proc examples:
# cat /proc/cpuinfo
# cat /proc/meminfo
# cat /proc/zoneinfo
# cat /proc/mounts

17#: Nagios - Server And Network Monitoring

Nagios is a popular open source computer system and network monitoring application software. You can easily monitor all your hosts, network equipment and services. It can send alert when things go wrong and again when they get better. FAN is "Fully Automated Nagios". FAN goals are to provide a Nagios installation including most tools provided by the Nagios Community. FAN provides a CDRom image in the standard ISO format, making it easy to easilly install a Nagios server. Added to this, a wide bunch of tools are including to the distribution, in order to improve the user experience around Nagios.

18#: Cacti - Web-based Monitoring Tool

Cacti is a complete network graphing solution designed to harness the power of RRDTool's data storage and graphing functionality. Cacti provides a fast poller, advanced graph templating, multiple data acquisition methods, and user management features out of the box. All of this is wrapped in an intuitive, easy to use interface that makes sense for LAN-sized installations up to complex networks with hundreds of devices. It can provide data about network, CPU, memory, logged in users, Apache, DNS servers and much more. See how to install and configure Cacti network graphing tool under CentOS / RHEL.

#19: KDE System Guard - Real-time Systems Reporting and Graphing

KSysguard is a network enabled task and system monitor application for KDE desktop. This tool can be run over ssh session. It provides lots of features such as a client/server architecture that enables monitoring of local and remote hosts. The graphical front end uses so-called sensors to retrieve the information it displays. A sensor can return simple values or more complex information like tables. For each type of information, one or more displays are provided. Displays are organized in worksheets that can be saved and loaded independently from each other. So, KSysguard is not only a simple task manager but also a very powerful tool to control large server farms.
Fig.05 KDE System Guard

Fig.05 KDE System Guard {Image credit: Wikipedia}

See the KSysguard handbook for detailed usage.

#20: Gnome System Monitor - Real-time Systems Reporting and Graphing

The System Monitor application enables you to display basic system information and monitor system processes, usage of system resources, and file systems. You can also use System Monitor to modify the behavior of your system. Although not as powerful as the KDE System Guard, it provides the basic information which may be useful for new users:

* Displays various basic information about the computer's hardware and software.
* Linux Kernel version
* GNOME version
* Hardware
* Installed memory
* Processors and speeds
* System Status
* Currently available disk space
* Processes
* Memory and swap space
* Network usage
* File Systems
* Lists all mounted filesystems along with basic information about each.

Fig.06 The Gnome System Monitor application

Fig.06 The Gnome System Monitor application
Bounce: Additional Tools

A few more tools:

* nmap - scan your server for open ports.
* lsof - list open files, network connections and much more.
* ntop web based tool - ntop is the best tool to see network usage in a way similar to what top command does for processes i.e. it is network traffic monitoring software. You can see network status, protocol wise distribution of traffic for UDP, TCP, DNS, HTTP and other protocols.
* Conky - Another good monitoring tool for the X Window System. It is highly configurable and is able to monitor many system variables including the status of the CPU, memory, swap space, disk storage, temperatures, processes, network interfaces, battery power, system messages, e-mail inboxes etc.
* GKrellM - It can be used to monitor the status of CPUs, main memory, hard disks, network interfaces, local and remote mailboxes, and many other things.
* vnstat - vnStat is a console-based network traffic monitor. It keeps a log of hourly, daily and monthly network traffic for the selected interface(s).
* htop - htop is an enhanced version of top, the interactive process viewer, which can display the list of processes in a tree form.
* mtr - mtr combines the functionality of the traceroute and ping programs in a single network diagnostic tool.

Did I miss something? Please add your favorite system motoring tool in the comments.


LinuxHQ: How to apply patches

LinuxHQ: How to apply patches
How to Apply Kernel Patches
With each new kernel release, there is a corresponding 'patch' The simplest way to patch your kernel is to follow the directions in the Kernel HOWTO - Patching your kernel.
How to Apply the Unofficial Kernel Patches
Patches are easy to apply, once you understand a few simple concepts:

* Patches are usually for a specific version of the kernel. This means old patches may not work with newer kernels.
* Patches are generally built from 'clean' unpatched kernel sources. So, one patch may make a change that causes other patches to fail.
* Patches are not part of the released kernel tree, thus do not be suprised it they don't work. Always keep a backup of your original kernel source!

Now, on to applying the patches. Normally all you need to do is simply issue the following command:

patch -p0 < patch-file-name-here

This should be done from the /usr/src directory.

Sometimes, the patch authors do not include the full path to the files that are being patched, in this case you will need to change to the directory that contains the file. Simply look at the patch file, in the first few lines you should see something like this:

--- drivres/block/rd.c.orig Tue Jul 2 17:08:41 1996
+++ drivres/block/rd.c Mon Sep 30 19:24:06 1996

This tells you that the file being patched is drivers/block/rd.c and the relative path from the /usr/src/ directory is included. But if you see something like this:

--- isdn_common.c~ Fri Nov 22 21:33:10 1996
+++ isdn_common.c Mon Mar 31 01:46:57 1997

This tells you that you will need to find the file isdn_common.c and change to the directory containing this file before you apply the patch.


From: http://www.linuxhq.com/patch-howto.html

ls command

ls -l

the alias for this command is "ll"


list the files in a long list format. also ignoring the hidden files begin with "."

Monday, January 18, 2010

SGE

Using Grid Engine
-----------------

You should now enter the command:

   source /gridware/sge/default/common/settings.csh

if you are a csh/tcsh user or

   # . /gridware/sge/default/common/settings.sh

if you are a sh/ksh user.

This will set or expand the following environment variables:

   - $SGE_ROOT         (always necessary)
   - $SGE_CELL         (if you are using a cell other than >default<)
   - $SGE_CLUSTER_NAME (always necessary)
   - $SGE_QMASTER_PORT (if you haven't added the service >sge_qmaster<)
   - $SGE_EXECD_PORT   (if you haven't added the service >sge_execd<)
   - $PATH/$path       (to find the Grid Engine binaries)
   - $MANPATH          (to access the manual pages)


Grid Engine messages
--------------------

Grid Engine messages can be found at:

   /tmp/qmaster_messages (during qmaster startup)
   /tmp/execd_messages   (during execution daemon startup)

After startup the daemons log their messages in their spool directories.

   Qmaster:     /gridware/sge/default/spool/qmaster/messages
   Exec daemon: <execd_spool_dir>/<hostname>/messages


Grid Engine startup scripts
---------------------------

Grid Engine startup scripts can be found at:

   /gridware/sge/default/common/sgemaster (qmaster)
   /gridware/sge/default/common/sgeexecd (execd)


Monday, December 7, 2009

Install CDT for Eclipse on Ubuntu

No eclipse-cdt package is found in the package list. We can install it through Eclipse.

1. open a terminal and start eclipse using root user: sudo eclipse
2. Form Help -> Install New Software... -> Add
3. Add:
Name: galileo
Url: http://download.eclipse.org/tools/cdt/releases/galileo
and return.
4. type filter text as "c" or "cdt", then in the listed package select CDT Main Feature package
5. Click to install.


Tuesday, December 1, 2009

wget: Download entire websites easy

wget is a nice tool for downloading resources from the internet. The basic usage is wget url:

wget http://linuxreviews.org/

Therefore, wget (manual page) + less (manual page) is all you need to surf the internet. The power of wget is that you may download sites recursive, meaning you also get all pages (and images and other data) linked on the front page:

wget -r http://linuxreviews.org/

But many sites do not want you to download their entire site. To prevent this, they check how browsers identify. Many sites refuses you to connect or sends a blank page if they detect you are not using a web-browser. You might get a message like:

Sorry, but the download manager you are using to view this site is not supported. We do not support use of such download managers as flashget, go!zilla, or getright

Wget has a very handy -U option for sites like this. Use -U My-browser to tell the site you are using some commonly accepted browser:

  wget  -r -p -U Mozilla http://www.stupidsite.com/restricedplace.html

The most important command line options are --limit-rate= and --wait=. You should add --wait=20 to pause 20 seconds between retrievals, this makes sure you are not manually added to a blacklist. --limit-rate defaults to bytes, add K to set KB/s. Example:

wget --wait=20 --limit-rate=20K -r -p -U Mozilla http://www.stupidsite.com/restricedplace.html

A web-site owner will probably get upset if you attempt to download his entire site using a simple wget http://foo.bar command. However, the web-site owner will not even notice you if you limit the download transfer rate and pause between fetching files.

Use --no-parent

--no-parent is a very handy option that guarantees wget will not download anything from the folders beneath the folder you want to acquire. Use this to make sure wget does not fetch more than it needs to if just just want to download the files in a folder.


From: http://linuxreviews.org/quicktips/wget/


Monday, October 12, 2009

Quicknet - Enable Learning Partial Weights

As in the original Quicknet_v3_20, the parameter mlp_lrmultiplier can scale the learning rate per-section. If the value is set to 0.0, then that section weight will not be updated. However, only it does not provide full freedom to set any section to be kept during training. As the values after the first non-zero value will be non zeros.

To remove this restrict, following steps need to be done:
In QN_MLP_BunchFlVar.cc:
QN_MLP_BunchFlVar::train_bunch() function:
about line 427:
if (cur_layer!=nlayers-1 && backprop_weights[cur_weinum+1])

ToDo: remove "&& backprop_weights[cur_weinum+1]"

In QN_MLP_BaseFl.cc
QN_MLP_BaseFl::set_learnrate() function:
about line 334:
else
     break;

ToDo: remove these two sentences.

The workable sourcecode, at least works for my purpose, can be found here: https://www.comp.nus.edu.sg/~li-bo/src/quicknet_linAF.tar

Friday, October 9, 2009

Quicknet_v3_20 Bug-I

There is a small bug in the softtarget trainer.

After the pre-run cross validation, the qnmultitrn stopped and gave out the error "segmentation fault".

This bug is simply because that in the file "QN_trn.cc", in the function(begins at line 598):

////////////////////////////////////////////////////////////////
// "Soft training" object - trains using continuous targets.

QN_SoftSentTrainer::QN_SoftSentTrainer(int a_debug, const char* a_dbgname,
                       int a_verbose,
                       QN_MLP* a_mlp,
                       QN_InFtrStream* a_train_ftr_str,
                       QN_InFtrStream* a_train_targ_str,
                       QN_InFtrStream* a_cv_ftr_str,
                       QN_InFtrStream* a_cv_targ_str,
                       QN_RateSchedule* a_lr_sched,
                       float a_targ_low, float a_targ_high,
                       const char* a_wlog_template,
                       QN_WeightFileType a_wfile_format,
                       const char* a_ckpt_template,
                       QN_WeightFileType a_ckpt_format,
                       unsigned long a_ckpt_secs,
                       size_t a_bunch_size,
                       float* a_lrscale)
    : clog(a_debug, "QN_SoftSentTrainer", a_dbgname),
      ...

Two variable debug and dbgname is not initialized. As debug is an integer, the uninitialized variable did not cause big problem. However, dbgname is a pointer which casued the "Segmentation fault".

To fix this bug only add the following two blue lines in the code.
 
    : debug(a_debug),
      dbgname(a_dbgname),

      clog(a_debug, "QN_SoftSentTrainer", a_dbgname),
      ...


Wednesday, August 12, 2009

Convert CHM files to HTML/PDF

From:http://linuxondesktop.blogspot.com/2008/07/convert-chm-files-to-htmlpdf.html

A few years back reading book involved going to the neighborhood book shop,purchasing the book and then finding cozy place to sit and read the book . However with the advent of Internet and computing with laptops getting smaller ,less bulkier and cooler and the easy availability of Ebooks on the internet scenario has changed.These days you could go to online book shop and purchase Ebook (any time of day ) and start reading them immediately , all this sitting in your Bed.However most of these Ebooks are in CHM format (Microsoft Compiled HTML Help) ,which is a native documentation format of Windows operating system. CHM basically combines HTML and it's associated images together into a single (.chm) file.

Now by default Ubuntu and many other Linux distributions do not include support for opening (.chm) files out of box owing to CHM file being proprietary file format of Windows operating system. There are viewers available on Linux which allows you to open these files , as i had highlighted in my previous article (Read Here ). Still if you want to convert (.chm) files to (.html) or (.pdf) , maybe for sending them to your friend who does not have this chm viewer installed you can do so easily .

First open Terminal from (Applications -> Accessories -> Terminal ) and issue the following command to install chmlib
sudo apt-get install libchm-bin
chmlib allows extracting HTML files and images from (.chm) files. Now if you want to convert extracted HTML files into PDF, PS etc , you would need to install htmldoc which you could install easily by issuing the following command in the terminal window :
sudo apt-get install htmldoc

Converting CHM files to HTML and eventually PDF


Now suppose you have a file named "Primer.chm" from which you want to extract HTML files and images into "Primer" directory , you could do so easily by issuing the following command in the terminal window :
extract_chmLib Primer.chm Primer
This should quickly extract all the HTML files and associated images from the chm file and put it into Primer directory.

Now once you have extracted the HTML , you are ready to convert them and combine them into a single (.pdf) file . Open the Terminal Window (Applications -> Accessories -> Terminal ) and issue the following command in the terminal window to launch "htmldoc"
htmldoc
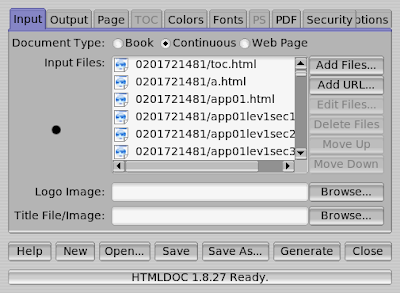
Once htmldoc finishes loading its interface ,click on Continuous radio button and press "Add Files..." and add all the files you would like to combine into single PDF document, as shown in image below :

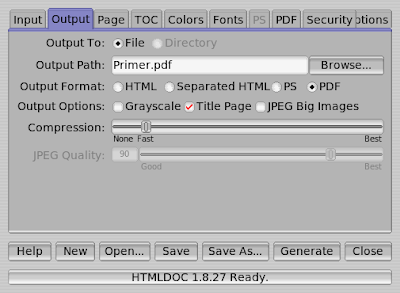
After choosing all the HTML files you would like to combine , click on the "output" tab and chose output file type to be PDF and the name and location of the finally generated PDF file.If you want you could change compression level , whether you want output to be in Grayscale etc .
Finally press the "Generate" button to actually start the process of combining (.html ) files with their images into single (.pdf) file .
Files being combined into single (.pdf) file
The entire process of combining (.html) files into (.pdf) files should not take more than few minutes , infact on my Core 2 Duo based laptop entire process of combining about 1000 page long book in HTML format to PDF format took 4 minutes.

Python Module

User defined module in python can be put in the same folder as the main script file. However, on our server when submitting jobs, absolute paths are needed, otherwise file won't be found. As the jobs on the server will be distributed to other machines for execution. In this case, where to put the used defined module?

One solution is creating a Shell script and call the main script using the absolute path, which is also the module's path.

Another solution is copy the user defined module into the python's installation folder, which is under the system lib folder, that's to say put the user defined module to the same place as the system modules.

Friday, August 7, 2009

Quicknet AF - II

From the files:
QN_fltvec.h - qn_sigmoid_vf_vf(...)
QN_fltvec.cc - qn_fe_sigmoid_vf_vf(...)
QN_fltvec.cc - qn_fe_sigmoid_f_f(...)

we can see that the sigmoid function used in the hidden layer is different from the sigmoid function  used in the output layer.
In the hidden layer, the sigmoid function is:
f(x)=1/(1+exp(-x))

In the output layer the sigmoid function is:
f(x)=tanh(s.a*b+c)

Sunday, August 2, 2009

Quicknet Activation Function in Hidden Layer

In the file, “QN_MLP_BunchFlVar.cc”, the function QN_MLP_BunchFlVar::forward_bunch(size_t n_frames, const float* in, float* out)  has the following part of codes:

// Check if we are doing things differently for the final layer.
if (cur_layer!=n_layers - 1)
{
    // This is the intermediate layer non-linearity.
   qn_sigmoid_vf_vf(cur_layer_size, cur_layer_x,
             cur_layer_y);
}
else
{
    // This is the output layer non-linearity.
    switch(out_layer_type)
    {
    case QN_OUTPUT_SIGMOID:
    case QN_OUTPUT_SIGMOID_XENTROPY:
    qn_sigmoid_vf_vf(cur_layer_size, cur_layer_x, out);
    break;
    case QN_OUTPUT_SOFTMAX:
    {
    size_t i;
    float* layer_x_p = cur_layer_x;
    float* layer_y_p = out;

    for (i=0; i<n_frames; i++)
    {
        qn_softmax_vf_vf(cur_layer_units, layer_x_p, layer_y_p);
        layer_x_p += cur_layer_units;
        layer_y_p += cur_layer_units;
    }
    break;
    }
    case QN_OUTPUT_LINEAR:
    qn_copy_vf_vf(cur_layer_size, cur_layer_x, out);
    break;
    case QN_OUTPUT_TANH:
    qn_tanh_vf_vf(cur_layer_size, cur_layer_x, out);
    break;
    default:
    assert(0);
    }
}

The activation function of MLP in quicknet tools, the activation function of hidden layers are all set to sigmoid by default.

Only the activation function can be set by users.

Wednesday, July 29, 2009

Shell Script Parameters


from:http://www.injunea.demon.co.uk/pages/page204.htm

Parameters:

A parameter is a name, a digit, or any of the characters *, @, #, ?, -, $, and !\^. So, what's the difference between a name and a parameter exactly? Not much actually, it's all in the usage. If a word follows a command, as in: ls -l word , then word is one of the parameters (or arguments) passed to the ls command. But if the ls command was inside a sh script, then in all likelihood the word would also be a variable name. So a parameter can be a name when passing information into some other command or script. Viewed from inside a script however, the command line arguments appear as a line of positional parameters named by digits in the ordered sequence of arrival (See - Script Example_1.1 ). So a parameter can also be a digit. The other characters listed are special characters which are assigned values at script start up and may be used if required from within a script.

Well after reading through the above, I am still not sure if this is any clearer. Lets see if an example can help to clarify things a little.

Script example_1.1 - The shell default parameters

<b>#!/bin/sh -vx
#######################################################
# example_1.1 (c) R.H.Reepe 1996 March 28 Version 1.0 #
#######################################################
echo "Script name is [$0]"
echo "First Parameter is [$1]"
echo "Second Parameter is [$2]"
echo "This Process ID is [$]"
echo "This Parameter Count is [$#]"
echo "All Parameters [$@]"
echo "The FLAGS are [$-]"</b>

If you execute the script shown above with some arguments as shown below, you will get the output on your screen that follows.


Friday, June 19, 2009

Sunday, June 14, 2009

SVN

Setting up on the server using source files:

apr-1.3.5.tar
apr-util-1.3.7.tar
sqlite-amalgamation-3.6.13.tar
subversion-1.6.2.tar

Create a new repository :

svnadmin create /home/sadm/svn/repos

Start the svnserve deamon:

svnserve –d –r /home/sadm/svn/repos


References:

http://svnbook.red-bean.com/nightly/en/svn-book.pdf

Monday, June 8, 2009

Very Short Tutorial: How to submit jobs through SGE?

Very Short Tutorial: How to submit jobs through SGE?

  1. Construct a short shell script that runs your program. In this example, we create submit_tut.sh with the following contents:

    date
    hostname
    uptime
    echo parameters are $*
    date

    Important Note: Please make sure that your script does not die before all your processes complete or our cleanup script will kill your processes. This can be assured by having a "wait" at the end of your script if you "background" any of your processes or (better) not use any background processes at all.

  2. Load the SGE settings.

    $ . /opt/sge/settings.sh

    Note the "." in front of "/opt/sge/settings.sh". You need that to source the settings file or it will not work!! Do this exactly once for every session you want to use SGE. You may also want to put it in your .profile.

  3. Submit your job:

    qsub < jobname >

    in our case:

    $ qsub submit_tut.sh

    $ qsub submit_tut.sh test

    $ qsub submit_tut.sh test test2

  4. Other SGE commands you might be interested in:

    You can check on the progress of your jobs by using the command

    $ qstat

    If you wish to abort your run, you can use the command

    $ qdel -u <userid> # or
    $ qdel <jobid>...

    Do not worry if your jobs went into the background as we have a cleanup procedure that will help you remove your processes within 5 minutes of your 'qdel'.

    SGE also does process accounting. Contents of the accounting database can be access using the command

    $ qacct

There is also a X11-based GUI tool for all of SGE's controls.

  1. To start it, you need to enable X11 forwarding. Here's a link containing instructions on setting up X11 support on a Windows machine.

  2. To verify if X11 is enabled on your particular session, just do

    $ echo $DISPLAY

    If the $DISPLAY variable is set to something like localhost:10.0, you're all set to go.

  3. Load the SGE settings if you have not done so.

  4. $ . /opt/sge/settings.sh

  5. Start the qmon program:

    $ qmon

Details about how to use the GUI and SGE are in the SGE User Guide availablehere.


From: https://www.comp.nus.edu.sg/cf/tembusu/sge.html

Common vi editor command list

Common vi editor command list

From:http://www.freeos.com/guides/lsst/misc.htm#commonvi

For this Purpose
Use this vi Command Syntax

To insert new text
esc + i ( You have to press 'escape' key then 'i')

To save file
esc + : + w (Press 'escape' key  then 'colon' and finally 'w')

To save file with file name (save as)
esc + : + w  "filename"

To quit the vi editor
esc + : + q

To quit without saving
esc + : + q!

To save and quit vi editor
esc + : + wq

To search for specified word in forward direction
esc + /word (Press 'escape' key, type /word-to-find, for e.g. to find word 'shri', type as
/shri)

To continue with search 
n

To search for specified word in backward direction
esc + ?word (Press 'escape' key, type word-to-find)

To copy the line where cursor is located
esc + yy

To paste the text just deleted or copied at the cursor
esc + p

To delete entire line where cursor is located
esc + dd

To delete word from cursor position
esc + dw

To Find all occurrence of given word and Replace then globally without confirmation 
esc + :$s/word-to-find/word-to-replace/g

For. e.g. :$s/mumbai/pune/g
Here word "mumbai" is replace with "pune"

To Find all occurrence of given word and Replace then globally with confirmation
esc + :$s/word-to-find/word-to-replace/cg

To run shell command like ls, cp or date etc within vi
esc + :!shell-command
For e.g. :!pwd

Google+